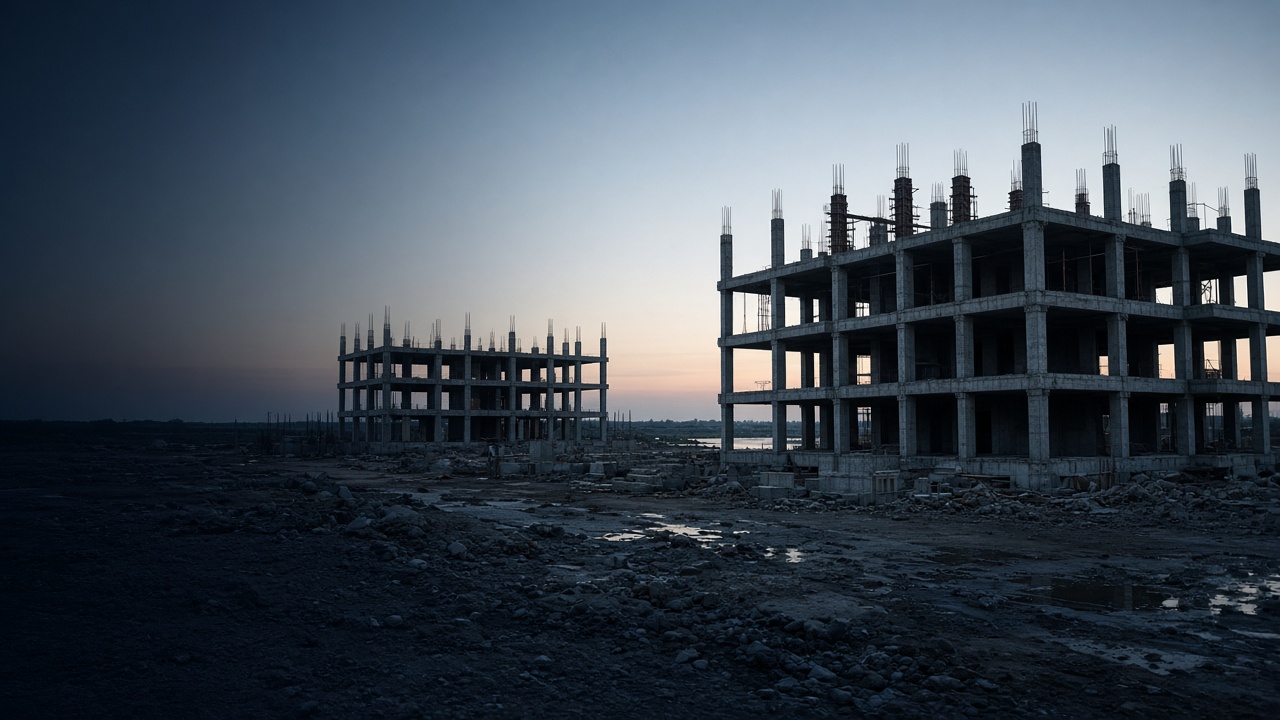
Unfinished residential frames standing empty on a large construction site at dawn.

The Crisis

Housing supply

Housing supply measures the homes available where households need them. Starts track projects entering construction, completions track homes delivered, and vacancies show how much of the existing stock is unoccupied.

UN-Habitat's adequacy estimates and CMHC's Canadian supply-gap range are examples of official attempts to quantify shortage. They are not interchangeable.

The 96,000-units-a-day figure through 2030 converts a global adequate-housing shortfall into a production pace. It does not say how many homes the world completed last Tuesday. The 1.1 billion people in slums and informal settlements sit inside the wider 2.8 billion adequacy estimate.

Canada shows what a national supply gap looks like when an agency publishes both sides. CMHC's six-month starts trend was 244,149 in August 2026. The same agency's modeled need is 417,000 to 469,000 annual starts to restore pre-pandemic affordability by 2036. The width of that range is about how strongly households respond to lower prices, not a license to pick a round number.

U.S. Census construction series and other national starts data will be attached as verified rows, not as guessed totals. Until a series is sourced, this page stays with named figures.

Sourced figures

Each figure carries a geography, period, and named source. None of these is a global median home price.

DATA

New units needed per day to 2030

96,000

housing units per day

Geography
World
Period
through 2030

UN-Habitat estimate of the production pace required to meet adequate-housing needs by 2030. This is a need estimate, not observed construction.

DATA

People in slums and informal settlements

1.1 billion

people

Geography
World
Period
2024

Included within the wider inadequate-housing estimate. Definitions of slums and informal settlements follow UN-Habitat / SDG 11.1 practice.

DATA

Annual starts needed to restore pre-pandemic affordability by 2036

417,000–469,000

homes per year

Geography
Canada
Period
through 2036

CMHC modeled range. The width reflects different assumptions about how strongly households respond to lower prices.

DATA

Housing starts, six-month trend

244,149

units, SAAR trend

Geography
Canada
Period
August 2026

CMHC six-month moving average of the seasonally adjusted annual rate of total housing starts.

Common questions

Why do housing shortage estimates differ?

Estimates depend on the area, time period, and outcome being measured. UN-Habitat estimates global need for adequate housing. CMHC models how many annual starts Canada would need to restore pre-pandemic affordability by 2036. Those estimates answer different questions.

Supply data